Building an Electrocardiograph
I apologize to anyone who may have tried to build this before June 6th,
2003 and failed. I misdrew the original schematic. IC2A had pins 2
and 3 reversed. I am very sorry about the mistake. (Thank you to the
person who pointed this out to me).
Please be aware that you are doing this at your own risk. I am not
responsible for any stopped hearts, practical jokes, code gone awry, or any
close encounters with a supreme being. Please understand the risks of
electricity before attempting anything on this site. In addition,
understand the potential for ground loops
and the lack of isolation. Be sure you read the upgrades
section - which has information on possible enhancements to the design.
Building materials
Although you can use any distributor you like, I suggest Mouser.
They're cheap, they have tons of stuff, and they don't have a minimum
order. If you came here before (or read the slashdot post), you'll notice
that the cost has gone up. That's because I put in some extra protection
items.
- $2.01 = 3 x LF353 - Dual Op-amp ($0.67 x 3) (you may be able to reduce cost
by purchasing two quad LF347 @ $0.67 each) - Mouser
- $0.55 = 5' x 2-conductor shielded wire ($0.11 x 5) - Home Depot
- $0.36 = 12 x 100k Ohm resistor 1/4 Watt 1% tolerance (0.03 x 12) - I personally used
5% carbon film resistors, but it appears as though metal film ones are now
cheaper and better. Maybe someone can tell me why. Mouser
- $0.24 = 8 x 10k Ohm resistor 1/4 Watt 1% tolerance (0.03 x 8) - two extra in
case 100k is too much resistance in the input stage - Mouser
- $0.35 = 1 x 1uF Ceramic capacitor - Mouser
- $0.08 = 1 x .1uF Ceramic capacitor - Mouser
- $0.18 = 6 x silicon diodes - 1N4001 (.03 x 6) - Mouser
- $0.43 = 1 x 1/8" (3.5mm) phone plug to connect to the sound card - Mouser
- $0.03 = 3 x Pennies for electrodes
- ------
- $4.23 - Total cost (Used to be $3.93)
The rest of the stuff I don't consider to be part of the cost of the project
- mostly because they're reusable and depend on how you plan on building it
- Proto-Type Board
- Soldering Iron
- Wire (to computer and to connect parts together)
- 9V battery
- Lotion
- Tape
Step #1 - Download the Visual Basic Program
It contains the source as well as an executable for the program. Run
ecg.exe to make sure everything works with your system.
Step #2 - Make sure the programs work with your system
As a general practice, we want to make sure everything works before you go
out and spend $4 on parts. So, first, go into the Volume control, select
Options -> Properties, and choose recording. You should get something
similar to this
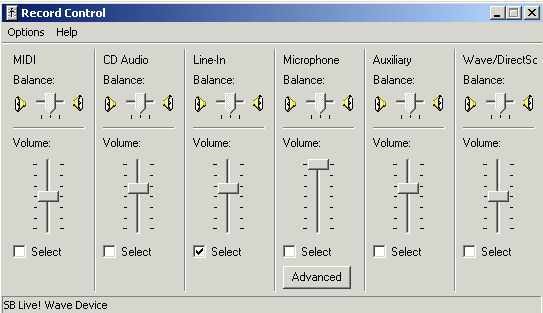
This menu shows what recording device you are selecting. Choose the
microphone. Plug in a microphone into the microphone jack on your sound
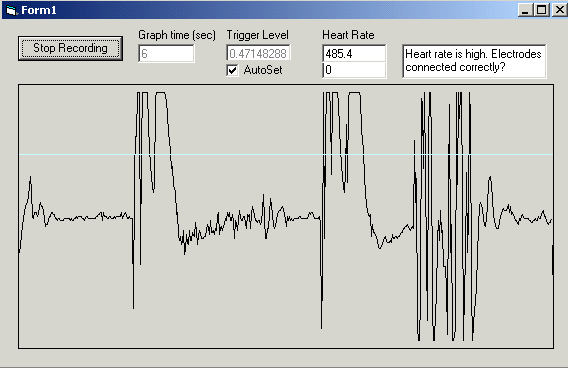
card. Run ecg.exe and click the "Start Recording"
button. Speak into the microphone to make sure that it is correctly
getting data from the sound card. The output should look similar to
this. (Versus just a straight black line)
Step #3 - Build the electrodes
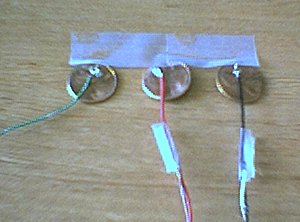
Solder a penny to each wire in the shielded cable. The shield is not
soldered to any pennies. Use another wire (or a different cable) to
connect the third penny. Allow it all to cool unless you like having
Lincon's head burned to your chest. :)
Step #4 - Download the schematic and build the
analog circuit
You can use a prototype board, solder the components together, or wirewrap
everything. It really doesn't matter. If you don't know how to use
a soldering iron, proto board, etc, you may want to ask a friend.
VDD is the + terminal of the battery/power supply
GND is the - terminal
IN+ and IN- go to the electrodes that go to your chest
BODY can go basically anywhere on your body (arm, leg, another point on the chest)
VDD/2 is a common connection to every node with that name.
The +VDD supply node on the op-amps (LF353) go to the + terminal of the battery
(sometimes labeled V+)
The -VDD supply node goes to the - terminal (sometimes labeled V-)
VOUT is the connection from the analog circuit to the input of the sound card. Connect VOUT
to the center pin of the phone plug. Connect the shielding of the phone plug to GND of the analog circuit.
Step #5 - Apply lotion to the non-soldered side of all of the pennies
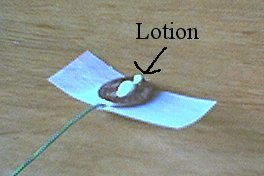
Step #6 - Tape the shielded electrode wires to your chest, the other
electrode to your arm (or somewhere else)
The connection to IN+ and IN- do not matter right now. If the
waveform is upside down, we'll just switch the leads.
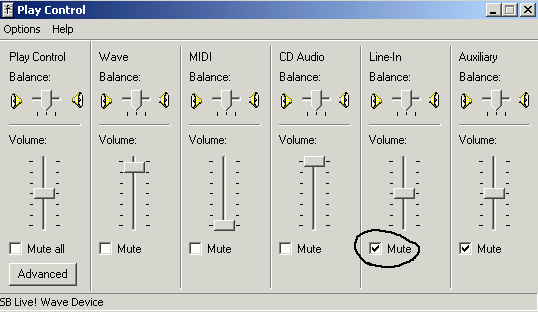
Step #7 - Disable the output of the CD-in or the Line-in device
We want to do this so that noise from the Line-In doesn't come out of the
speakers. It's kind of annoying to hear a lot of noise while we're
making connections or debug something
Step #8 - Plug the phone plug into your computer's CD-in or Line-in
Step #9 - Set the recording device to Line or CD (Similar to Step #2)
Step #10 - Run the ecg.exe program & click on "Start
Recording"
You should be able to see your ECG now!
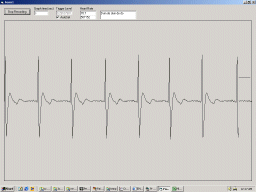
The blue line helps keep track of what part of the graph is being
updated. It also signifies the heart rate trigger. When the signal
crosses the line, it calculates the time since the last trigger, then
calculates what the resulting heart rate is. The trigger level
will change depending on the amplitude of the signal input.

To the right of "Start Recording" is the graph interval.
You can set this number prior to clicking "Start Recording."
It tells the program how long the graph should draw before overlapping.
For example, a setting of 5 means that you can view 5 seconds of ECG data
before it starts drawing from the beginning.

To the right of the graph time is the trigger level setting. Normally,
you should leave it to auto-trigger. However, if you want to manually set
the trigger level, you can.

Next to that is the Heart Rate display. It displays the calculated
heart rate in beats per minute. Below the heart rate display is just a
debugging tool that shows the ECG is working.
That's the basics of the program. If you have any questions, please
feel free to contact me (remove the nospamy). Have
fun.
Return to Main


