RECONFIGURABLE
PATTERN
GENERATOR
CHIPS
(MS
THESIS)
Project Overview
This is joint project between the University
of Utah and Case Western Reserve University. The aims of the project are
two-fold: 1) study reconfigurable central pattern generators and develop
mathematical models that adequately describe their operation, and 2) develop
and characterize an analog VLSI implementation of the pattern generators.
The first portion of the project is being conducted by researchers at Case
Western (PIs: Randall Beer
and Hillel Chiel).
The second portion of the project is being conducted here at the University
of Utah (PI: Reid Harrison).
CPGs are relatively small neural networks found in the spinal cord of
all animals. CPGs are responsible for creating the rhythmic patterns of
motor activity necessary for common animal behaviors such as walking, swimming,
breathing etc. It has been shown that in the absence of sensory input CPGs
are capable of generating the basic pattern of motor activity which results
in walking in cats. Moreover, it has been observed that CPGs with fixed
neural connectivity can create multiple stable patterns of motor activity.
Modeling
Many options are available for modeling neurons and neural networks. Some
models strive to capture the spiking nature of real neurons in hopes of
exploiting the timing relationships among many neurons. At the opposite
end of the spectrum are the so-called 'mean rate' models which assume that
the information of interest is encoded by a neuron's average firing rate.
For this work the Continuous-time Recurrent Neural Network (CTRNN) model,
a mean rate model, was chosen. Each CTRNN neuron is described by a first-order
differential equation
 where yi is the state of the ith neuron,
 i
is the time constant of the ith neuron, wij
is the synaptic weight from the jth neuron to the ith
neuron,
i
is the time constant of the ith neuron, wij
is the synaptic weight from the jth neuron to the ith
neuron,  j
is
the bias value for the jth neuron, and
  (x)
is the logistic sigmoid function,
 and Ii is an unweighted input. The neuron states, yi,
can be thought of as modeling the mean cellular membrane potential of a
biological neuron. In biological neurons, the instantaneous value of the
membrane potential determines when the neuron will fire an action potential
(spike). In many systems information is encoded by the rate at which a
neuron fires action potentials. Models such as CTRNNs make the assumption
that the average firing rate, not the individual spikes, carries the information.
It further assumes that the neurons have some maximum firing rate (this
assumption is directly supported by experiment). Therefore, the output
of each neuron in a CTRNN is defined to be
  (yi+
(yi+  i).
i).
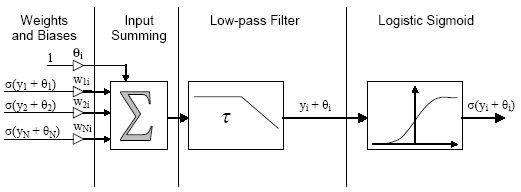
Block diagram of a CTRNN neuron (the Ii input is
omitted)
Notice that as the name implies CTRNNs allow for fully interconnected
networks with recurrent (self) connections. For this reason, CTRNNs exhibit
rich dynamical behavior. Of particular interest in this project are the
stable limit cycles that may by encoded into a CTRNN. Typically, the weights,
biases, and time constants of a given network are determined through the
use of a genetic algorithm. Once the network parameters are determined,
they remain fixed i.e. no on-line learning takes place. Rather, inputs
may be applied to the network via each neuron?s Ii input in order to effect
change in the network's activity. This can most easily be seen through
an example.
Reconfigurability Example
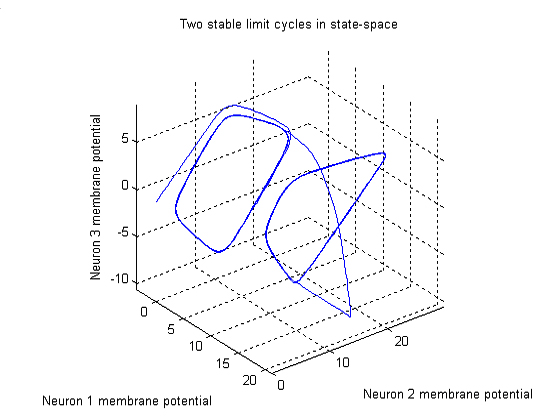
Consider a three neuron network with fixed parameters (connectivity) and
one external input. If the outputs of the neurons are plotted in 3D state-space,
we can see that two stable limit cycles exisit. You can click on the figure
to view an animation of the figure as it rotates. The figure shows that
the system began with zero initial conditions and quickly slipped into
a stable limit cycle. After some time, the I1 input was
pulsed with a value of 10 and the system followed a new trajectory to a
new region of the state space. After, the stimulus on I1
is removed, the system again settles into a limit cycle. However, the shape
of the limit cycle has been distorted because it is located in a different
region of the state space.
 Perhaps the best way to visualize the state space is though the use of
a direction field and a thorough examination of the system equilibria as
revealed by the intersection of system's nullsurfaces. However, for a 3D
system, the nullsurfaces and hence equilibrium solutions are complicated
and a bit hard to plot in a way that is easy to interpret.
Fortunately, all is not lost. When the limit cycles are examined in
the 3D animation, one may observe that they are relatively flat with respect
to neuron 1's membrane potential. Suppose we deal with a series of 2D slices
through the 3D state space as the system evolves in time. This would allow
us to see how the state space is distorted as a function of neuron 1's
membrane potential. The direction information along neuron 1's axis would
still be absent of course, but that along the other two neurons's axes
would be preserved.
The following figure is a snapshot of a movie (click on the figure to
view the movie) that illustrates the evolution of the three neuron system
in time.
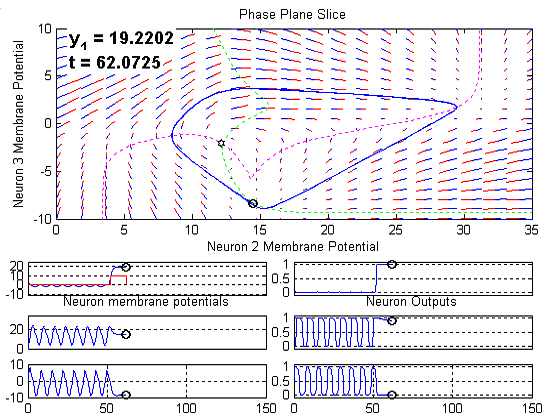
Several graphs are shown:
The large plot on the top represents state space slice described above.
The direction field is indicated using a series of red and blue lines.
The red half of the line indicates the direction and the total length of
the line segment is representative of the local spatial rate of change
(spatial derivative). The dashed magenta and green lines represent the
intersections between the neuron 2 and neuron 3 nullsurfaces and the 2D
state space slice. The intersection of these two nullsurfaces is marked
as an unstable spiral and this behavior is confirmed by the surrounding
direction field. Projections of limit cycles near the current slice are
indicated in blue and the 10 most recent samples of the system trajectory
are indicated by the moving black dots. Finally, the current value of neuron
1's membrane potential is indicated along with the current time in the
upper left of the graph.
The three plots on the bottom left of the figure are simply the neuron
membrane potentials plotted versus time. Note that time units are arbitrary
here. In the upper left plot, which corresponds to neuron 1's membrane
potential, the I1 signal is plotted in red.
The three plots on the bottom right show the neuron outputs. Recall
that CTRNNs model the mean firing rate of the neurons, therefore the plots
in the bottom right represent mean firing rate, normalized to the maximum
possible firing rate.
The Chips
I have designed two chips to implement four-neuron CTRNNs. The first chip,
neuralnet1, made use of external RC networks to implement the dynamics
of the CTRNN neurons. The main focus of the chip was the development of
a compact, current-mode programmable synapse. For the second chip, I eliminated
the external RC networks to realize a fully-integrated CTRNN chip. Both
chips contained four fully-interconnected neurons with programmable weights
and biases. They were fabricated through MOSIS using AMI's 1.5-µm
process.
neuralnet1
The neuralnet1 chip uses a mix of internal
and external components to implement the CTRNN neurons. The programmable
synapses, input summing, and logistic sigmoid circuits are on-chip while
the low-pass filter is realized by an off-chip RC-network. The low-pass
filter is located off-chip for two reasons: 1) it functions simultaneously
as a LPF and an I-to-V converter and wide linear range I-to-V converters
are difficult to realize in subthreshold CMOS, 2) the primary objective
of the chip is to develop digitally programmable synapses and including
integrated LPF circuitry might make it difficult to characterize the synapses.
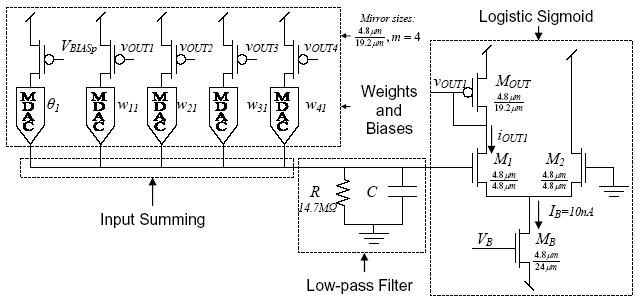
Schematic of neuron 1 in the four neuron network on the neuralnet1
chip
The basic schematic of one neuron on the neuralnet1 chip is shown above.
The synapses (labeled MDAC) are passive current-mode digital-to-analog
converters. The reference currents for the DACs are taken from 4:1 current
mirror copies of the output currents from the other neurons i.e. they are
wired as multiplying DACs (MDACs). The MDACs have 5-bit precision
and are capable of storing positive and negative (excititory and inhibitory)
weights. Details of the MDAC implementation and characterization and the
overall performance of the network will be available in an upcoming paper
to be published at ISCAS 2004.
Die Photos
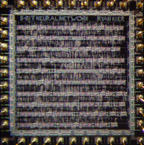
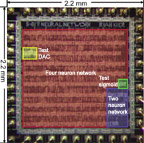
The chip contains two test circuits (a DAC and a sigmoid circuit), a fully-programmable
four neuron network, and a hard-wired two neuron network. It was layed
out using Tanner's place and route tool because of time constraints.
neuralnet1 die
neuralnet1 labelled die
neuralnet2
The neuralnet2 chip eliminates the need for external RC networks. Two operational
transconductance amplifiers (OTAs) and an integrated capacitor array replace
implement the I-to-V converter and low-pass filter functions. The low-pass
filter time constants are made independently programmable by using an MDAC
circuit to control the bias current in the low-pass filter OTA. More details
and schematics to come soon.
Die Photos
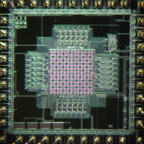
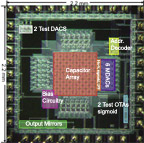
The chip contains several test structures: two types of MDACs, two types
of OTAs, a sigmoid circuit, and a translinear CMOS 1/x circuit. The test
structures are in the upper left and lower rigtht corners of the die. The
four blocks on the lower left of the die are large 80:1 output current
mirrors for the neuron outputs.
A four-neuron CTRNN is located in the center of the chip. This chip
was layed out by hand and incorporates a large bus structure that saves
alot a routing space (space that was wasted in the neuralnet1 chip). The
capacitor array can be seen in the center of the chip. It contains 160
1-pF poly-poly caps. The circuitry for each neuron can be seen surrounding
the capacitor array with one neuron per side. Most of the neuron
area is taken up by the MDACs. The OTAs and sigmoid circuit are located
between the MDACs and the capacitor array.
neuralnet2 die
neuralnet2 labelled die
Copyright © 2004 by Ryan Kier. All
Rights Reserved.


