

PROJECT 5
CS/BIO 6640 - IMAGE PROCESSING
Fall Term 2011
Assigned November 26
Due December 13 (Before midnight)
Feature and Object Detection
The goal of this project is to build a feature detection and
analysis system. The system should take as input a greyscale image
and produce a set of shape descriptions. It is strongly advised
that you build the software piece by piece and debug each module as
you go.
You will need to implement and demonstrate the operation of
the following:
- You should implement a zero crossing algorithm, that produces
single-pixel thick lines that divide images into positive and negative
regions.
- You should implement the Marr-Hildreth
(zero crossings of Laplacian of the Gaussian)
or Canny edge detector
(zero crossings of second derivative in the gradient direction),
with a threshold on gradient magnitude. Hysteresis thresholding is
nice to have, and good for extra credit on this section, but not required for this project.
- You will need a convolution based denoising (blurring or low-pass transform) algorithm to
prepare the image for differentiation
- You should find (e.g. on the web--document your sources) or implement median and bilateral
filtering that is efficient on reasonable
sized neighborhoods (e.g. up to 9x9) and apply them, possibly iteratively.
You could, instead find (document sources) or implement Anisotropic Diffusion.
Experiment with different numbers of iterations or neighborhood sizes or parameters. Show results from these experiments.
- You should implement this as an edge-detection pipeline and experiment with
parameters and demonstrate it on a set of synthetic and real images of
your own choosing.
- Find some test images that have strong lines -- synthetic
images are OK, but make sure you show some results on real photographs.
We have included several
images
for testing purposes.
Find two or three other images to demonstrate.
- You should use a Hough transform for the line detector.
This transform is described on pages
733-738 in the book.
- Make sure you present the results visually. The easiest way to do
this is to create a function that draws a set of colored pixels across the
image for each line it finds. The easiest thing is to express the
parametric form of the line and march along at regular intervals and
make those pixels (round off) a specified color. There are nicer ways
to draw lines from the graphics literature, but you don't need to do
that for this project.
For extra credit, you can implement
some intelligent clipping of these lines to conform to line segments in the data, but this is not necessary.
Hints:
- The edge detector should be in the form of a binary image. You then
should loop through that image and allow each pixel to contribute to
the accumulator space.
- The hard part of this project is finding peaks in the accumulator
space. Treat the accumulator space as another ``image''.
You should filter/smooth it. Look for local maxima and then threshold, or
threshold (to find small blobs) and then find centers of these blobs
or iteratively ``whittle'' them down to a single pixel.
- Debug your programs on some synthetic images, e.g. a white square on dark background.
- Do the project in stages and present results at each stage.
The purpose of this part of the project is to build a system for
detecting circles (of prespecified radius--you don't need to determine the radius automatically) in images.
- Build a system that detects circles of a specified size (within some
tolerance). This should be done by first doing edge detection and
then constructing the Hough transform, blurring it, and then looking
for maxima on this function. Demonstrate results on synthetic images
of your own design.
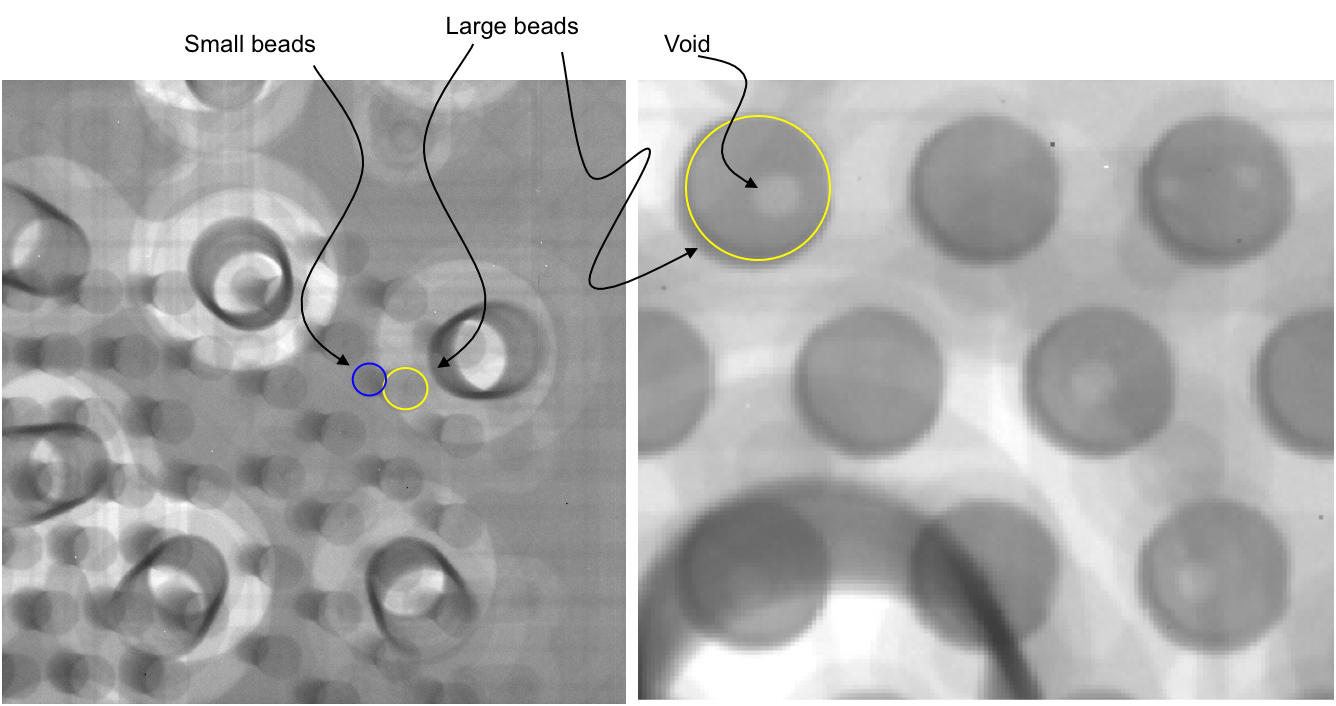
- Tune and test your system to detect the two different sized
solder beads and ``voids'' (light-color bubbles in the bead)
from the x-ray image of the surface-mount packaging.
This is a quality control problem where chip manufacturers are
trying to determine how well the contacts align for each mounted
component. You will need to hand-tune the radii by looking at images. Demonstrate your results on these
test images.
Hints:
- If the Hough transform parameters are simply translation on the same
grid resolution as the image, as in this
case, the accumulator space values are simply a cross correlation with a
discrete version of the shape itself (i.e. match filtering).
Blurring can be done by bluring the filter or bluring after fact. It
doesn't matter -- they can be done either way and either the Fourier
or spatial domains.
You can find images
here..
This document was generated using the
LaTeX2HTML translator Version 2002-2-1 (1.71)
Copyright © 1993, 1994, 1995, 1996,
Nikos Drakos,
Computer Based Learning Unit, University of Leeds.
Copyright © 1997, 1998, 1999,
Ross Moore,
Mathematics Department, Macquarie University, Sydney.
The command line arguments were:
latex2html -split 0 project5.tex
The translation was initiated by Ross Whitaker on 2013-11-26


Ross Whitaker
2013-11-26
