CS6640 - Project 4
Assigned Oct 24, 2013
Due Nov 17 (Just before midnight)
The purpose of this assignment is to experiment with the use of the
Fourier transform for image registration and filtering and to build a
small system that automatically builds a mosaic from a small set of
overlapping input images.
Implement a Fourier based routine that computes the phase
correlation between two images of the same size. This routine
should return the result of the phase correlation in the spatial
domain. I.e. for images  and
and  , the phase correlation is
In practice, you will need to extend your phase correlation to remove
high-frequency components and noise. Thus, you will need a routine that computes
where  is a low-pass transoform. Make a separate routine that
builds .
is a low-pass transoform. Make a separate routine that
builds .
You will need to find the peak in the phase correlation. For
starters, you can simply look for the pixel location with maximal
value. You will need to make some decisions. For instance, if the
maximum value is below some threshold, you would say that two images
do not overlap. For more advanced analysis, you would look for
connected compentents in the correlation image above some threshold
and do some averaging of magnitude and position within those
components in order find the best ``peak'' to associate with the
offset of the two image. Think about what would work best and come up
with your own design and test it and describe it in the report.
You should build a routine that reads in a set of images (specified in
a file) and builds and saves a mosaic. You can, perhaps, assume that
the first image defines the target. You will, as in your last
project, need to make a canvas and resample all images onto the
canvas. Don't worry about blending, etc., for now. Just build the
mosaic using whatever scheme you want between the overlaping images
and evaluate the effectiveness. To compute the phase correlation
between two images, they need to be the same size. Thus, you will
need to preprocess images by appending rows/columns so that they all
have the size of the max row and column among all the images. I
suggest padding with the average image value, or, possibly, by
repeating the edge pixels or putting noise around the border.
To make things simple you should pad on
the right edge and bottom, keeping the origin of the image in place.
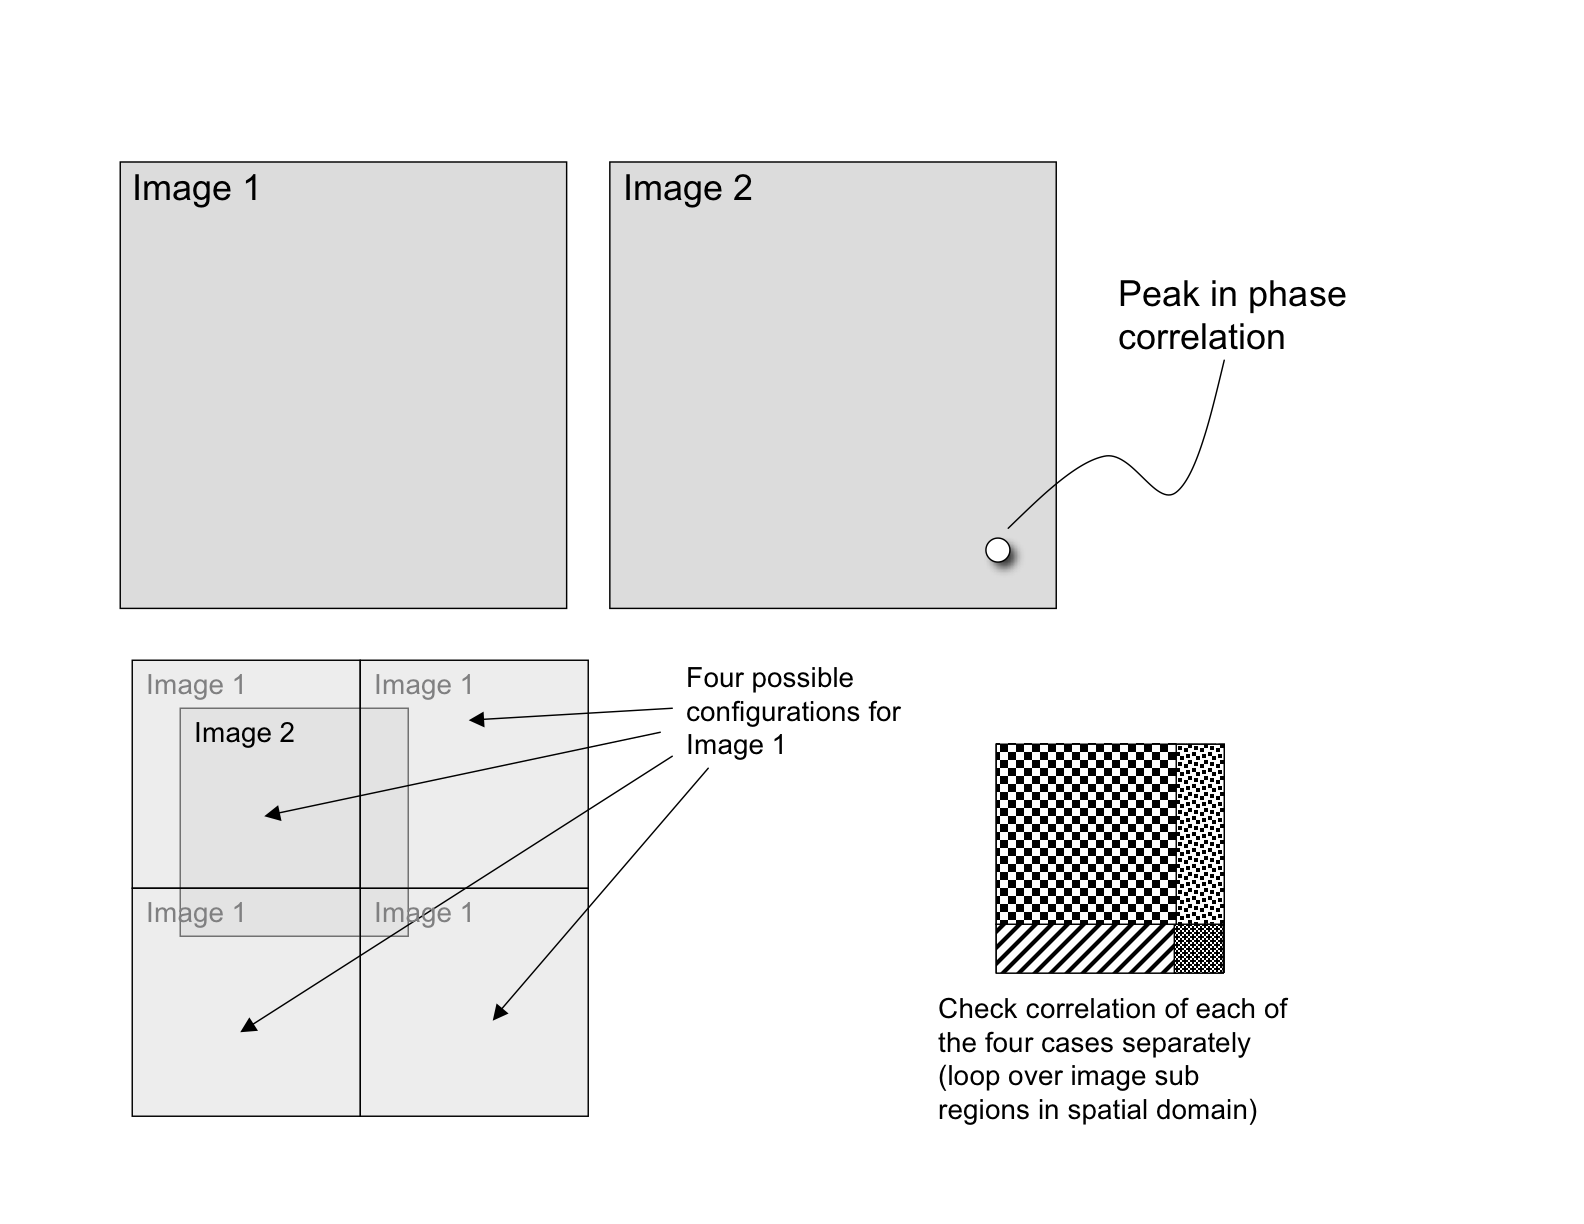
Because phase correlation in the image domain allows for wrap around,
there is an ambiguity in the meaning of a phase correlation peak.
There are two strategies to solve this. One strategy is to pad the
image to be more than twice as big as the inputs in every direction.
If you get peaks that are bigger than half the padded image, then you
know that these result from the wrap around of the image in that
direction.
Another approach is to pad as needed for the FFT and then resolve the
four cases of ambiguity after you find the peek. To do this you would
set up four separate loops to compute the correlation on the
overlapping patches in the spatial domain, as shown in
Figure ![[*]](file:/sw/share/lib/latex2html/icons/crossref.png) .
.
You should experiment with the set of six images given
here.
You should also build a toy example to debug with. To do this, you can
take a simple image and manually (using an image editing tool) break
it into a couple of overlaping pieces. Experment with different
thresholds and different low-pass filters or parameters.
You should not implement an FFT from scratch. In Matlab, you
can use the routine fft(), which computes the 1D FFT of a
signal, or fft2() which computes the FT from a 2D array.
In Vispack, you can use the code given
here, and have a quick look at the
readme file.
- Write your project code in a single directory, called project4.
- For Matlab, each individual function (including functions you define) should be a ``.m'' file, and your
functions should call one another as necessary. Likewise, in C++ clearly separate these different functions and document how you have organized the code.
- Your project report will be in the form of an html file called
index.html,
contained in that directory. All links from that file must be
relative and all other files necessary to read your report must be in
that directory (or subdirectories).
- You should use examples of images in your report. They should
be viewable in the browser when we open your html file.
- You will submit a single tar file created from from your project
directory with the unix command tar -czf project4.tgz ./project4 or something equivalent on another operating system.
This document was generated using the
LaTeX2HTML translator Version 2002-2-1 (1.71)
Copyright © 1993, 1994, 1995, 1996,
Nikos Drakos,
Computer Based Learning Unit, University of Leeds.
Copyright © 1997, 1998, 1999,
Ross Moore,
Mathematics Department, Macquarie University, Sydney.
The command line arguments were:
latex2html -split 0 project4.tex
The translation was initiated by Ross Whitaker on 2013-10-06
Ross Whitaker
2013-10-06