


CS6640 - Project 2
Assigned Sept 12, 2013
Due Sept 27 (Just before midnight)
The purpose of this assignment is to develop you understanding of image histograms and histogram equalization.
Histogram Equalization
- Implement a Matlab (or C++) function (you can use or build on one that already exists in the Matlab base, if you want):
histogram(I, n, min, max)
that takes a 2D array (or image) I as input
and returns a 1D array of floats (length n) that give the relative frequency of
the occurance of greyscale values in each of the n bins that
equally
divide the range of values between min and max.
- Implement a function
histoeq(I, n, min, max)
that takes a 2D array (or image) I as input (e.g. VISImage<float> in Vispack)
and returns an image of the same type that has undergone histogram
equalization using n bins and has a range of outputs that spans
the range between min and max.
- Use this routine to transform and enhance the following images:
- Crowd
- University
- Cars
- Portal
- In addition, include in your discussion 2-3 of your own greyscale
images that you think would be interesting from the point of view of
this exercise. I.e. that have bad contrast characteristics and that might be improved by histogram equalization.
- Show graphs of the histograms of the images before and after equalization and explain their appearance.
- Discuss (briefly) why histogram
equalization is or is not effective for each image.
- Derive an algorithm that processes an image to return an image with a
histogram (pdf) that has at every grey level a value that is a linear
blend of the input histogram and a flat histogram. Implement a
matlab function
histoeq(I, n, min, max, alpha)
where alpha is a float between 0 and 1 and every bin is (in principle) equal to
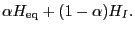 Thus, for a value of alpha = 0, the
output equals the input and for a value of 1 the output is the same as
histoeq(I, n,).
Experiment and
report results on some of the images listed above. Explain the results you get.
Thus, for a value of alpha = 0, the
output equals the input and for a value of 1 the output is the same as
histoeq(I, n,).
Experiment and
report results on some of the images listed above. Explain the results you get.
- Implement a function
that returns the input image which has been transformed by adaptive
equalized histogram equalization using square neighborhoods (allowing
for boundaries). The function should be
AHE(I, n, windowsize)
You may use whichever algorithm you
choose. The function should treat windowsize as an optional parameter. If windowsize is left empty (set to -1) your routine should make a
reasonable choice of tile or window size based on the size of the
image, etc.
If you use the tiling method, then the window size parameter could be modified to fit into the image. In this case, you should make windows as square as possible.
Make sure that
your function is a sensibly efficient implementation (avoid obviously redundant computation) of whatever
algorithm you choose.
- For the images given in 1 above (the samples given you
and the ones you bring in yourself) try adaptive histogram
equalization, with different values of window size.
- Discuss the time
it takes to run and its effectiveness for each image.
- Comment on and explain any artifacts in the results.
Implement a version of Clipped LAHE (CLAHE). Explain your algorithm
in the report, and if you used ideas from any outside resources. The
clip value should be specified as an input parameter. The function
should be
CLAHE(I, n, cliplevel, windowsize)
Try your algorithm on a variety of images and compare against the
unclipped version. What values of clipping are effective and why?
- Write your project code in a single directory, called project2.
- For Matlab, each individual function (including functions you define) should be a ``.m'' file, and your
functions should call one another as necessary. Likewise, in C++ clearly separate these different functions and document how you have organized the code.
- Your project report will be in the form of an html file called
index.html,
contained in that directory. All links from that file must be
relative and all other files necessary to read your report must be in
that directory (or subdirectories).
- You should use examples of images in your report. They should
be viewable in the browser when we open your html file.
- You will submit a single tar file created from from your project
directory with the unix command tar -czf project2.tgz ./project2 or something equivalent on another operating system.
This document was generated using the
LaTeX2HTML translator Version 2002-2-1 (1.71)
Copyright © 1993, 1994, 1995, 1996,
Nikos Drakos,
Computer Based Learning Unit, University of Leeds.
Copyright © 1997, 1998, 1999,
Ross Moore,
Mathematics Department, Macquarie University, Sydney.
The command line arguments were:
latex2html -split 0 project2.tex
The translation was initiated by Ross Whitaker on 2013-09-12
Ross Whitaker
2013-09-12