CS6640 - Project 1
Assigned Aug. 26, 2013
Due Sept. 11 (Just before midnight)
The purpose of this project is for you to develop the software
platform you will use for the course (C++ or Matlab), to get familiar
with the process and expectations for reports, and to write code and
experiment with thresholding and connected components in images.
Build a Histogram
Implement a function or routine, for instance in matlab
histogram(I, n, min, max)
that takes a 2D array (image) I as input (integers or floats)
and returns a 1D array of floats (length n) that give the relative frequency of
the occurance of greyscale values in each of the n bins that
equally (to within integer round off)
divide the range of (integer) values between min and max.
Experiment with this function on different images and show graphs or plots, in
your report, of the histogram. Explain how the histogram makes sense
for each particular image. For the graphs you can use whatever
software you want, e.g. Matlab plotting routines, MS Excell, Open
office. Document how you did it and show examples.
You will write software to do a connected component analysis
and apply it to the problem of dividing an image into pieces based
on a set of thresholds.
Implement software routines (functions) that do the following:
- Dual threshold routine that takes two thresholds and returns a
binary image of pixels that fall between them.
- Flood fill with inputs of binary image, a seed point, and label
value (for the output) and a label image (for the output) and
returns a flood fill on the label image with the label value.
- Connected component routine that takes as input a binary image,
starting label value, label image, and returns the revised label
image, with new labels in the CCs for this binary map, and an ending
label value.
You should experiment with thresholds, using your histogram from the
first part, and connected components on the following images:
- Turkeys:
Dark turkeys on a
light background. Single threshold.
- Simple Shapes:
A simple
example with 3 shape (4 intensities with background) and noise.
- MRI Brain:
A brain
with 3 types of tissues and air (4 intensities with background) and
noise.
You must also experiment with several of your own images.
Hints: For visualization, many viewers will allow you to assign
random colors to greyscale intensities (i.e. your label map), in order to get color images
that show regions.
Write code to remove connected components that are smaller than a certain threshold. You should
convert the labels for these components to the label of an adjacent
component -- ideally the component that has the largest boundary
with the little one. This is easy to do if you think about a 1-pass
algorithm where pixels ``vote''.
Hints: It will pay to associated with each connected component a small
array of data so that you can keep track of the size, neighboring
component pixels, etc.
You should experiment with your system on the images above and a few
images you find yourself. Try different thresholds for intensity and component size
and shows results. Also, discuss what further additions you could make to your system to get better results for these problems.
An example of the way this ``system'' would operate is given in the
figure below. The input image on the right contains regions with 3
different grey values--black, white, and grey. Thus, two thresholds
would be necessary. One threshold to distinguish black from
grey/white (black is below the threshold). The second threshold would
distinguish grey from white (grey is below). Combining the connected
component analysis on these three binary outputs would produce a set
of labels, as shown (by color) in the middle figure. If we then run
the topological denoising algorithm, we might (if we set the size
threshold properly) remove all the small diamond-shaped regions.
Those regions get labels that allow them to blend into adjacent
regions, as shown in the figure on the left.
Figure 1:
Right) An input image has three distinct type of regions: black, grey,
white. Middle) A connected component analysis run on two different
thresholds gives a set of labels (shown as different colors). Left)
Removal of small regions and relabelling to merge with adjacent
regions.
|
|
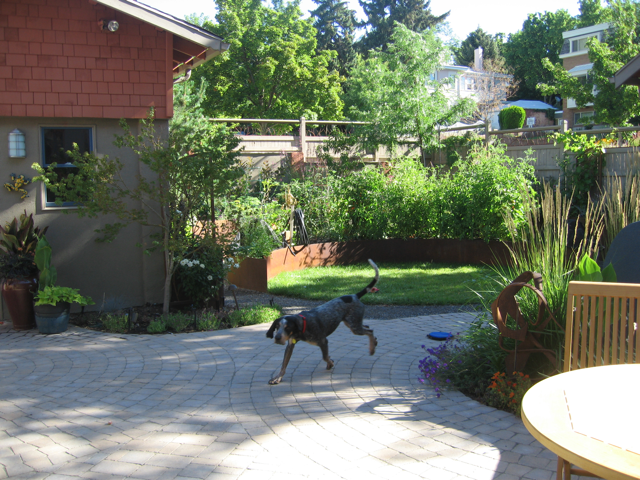
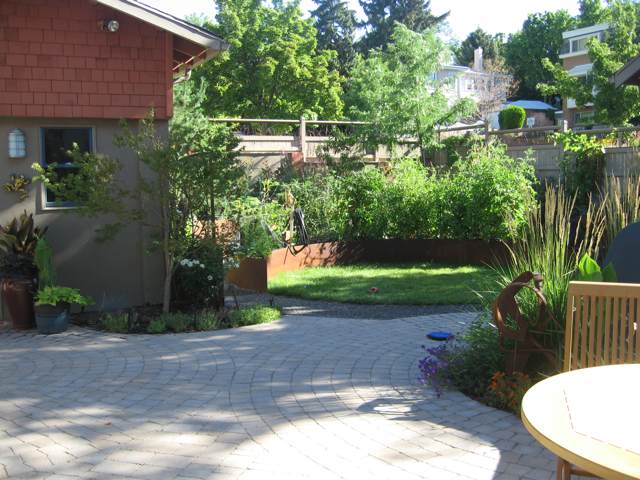
Using the methods from above (connected components, topological denoising), to write code to automatically find moving objects (components) in images. You can subtract to images from a static camera to find what has changes. Use this system to find the dog in the images below:
You can find the images
here
and
here
.
Generate your own sequence of images to test this approach on. Discuss the challenges of making this method work effectively.
- Write your project code in a single directory, called project1.
- For Matlab each individual function (including functions you define) should be a ``.m'' file, and your
functions should call one another as necessary.
- You should have in your report a short description of each
algorithm you used and documentation on how your code is organized.
Failure to do this will result in a loss of points.
- Your project report will be in the form of an html file called
index.html,
contained in that directory. All links from that file must be
relative and all other files necessary to read your report must be in
that directory (or subdirectories).
- You should use examples of images in your report. They should
be viewable in the browser when we open your html file.
- You will submit a single tar file created from from your project
directory with the unix command tar -czf project1.tgz./project1.
This document was generated using the
LaTeX2HTML translator Version 2002-2-1 (1.71)
Copyright © 1993, 1994, 1995, 1996,
Nikos Drakos,
Computer Based Learning Unit, University of Leeds.
Copyright © 1997, 1998, 1999,
Ross Moore,
Mathematics Department, Macquarie University, Sydney.
The command line arguments were:
latex2html -split 0 project1.tex
The translation was initiated by Ross Whitaker on 2013-09-04
Ross Whitaker
2013-09-04